3. The User Interface
Tip
It’s helpful to have a session of GlobalTrack open in a separate browser window when reviewing the User Interface documentation.
3.1. Project List
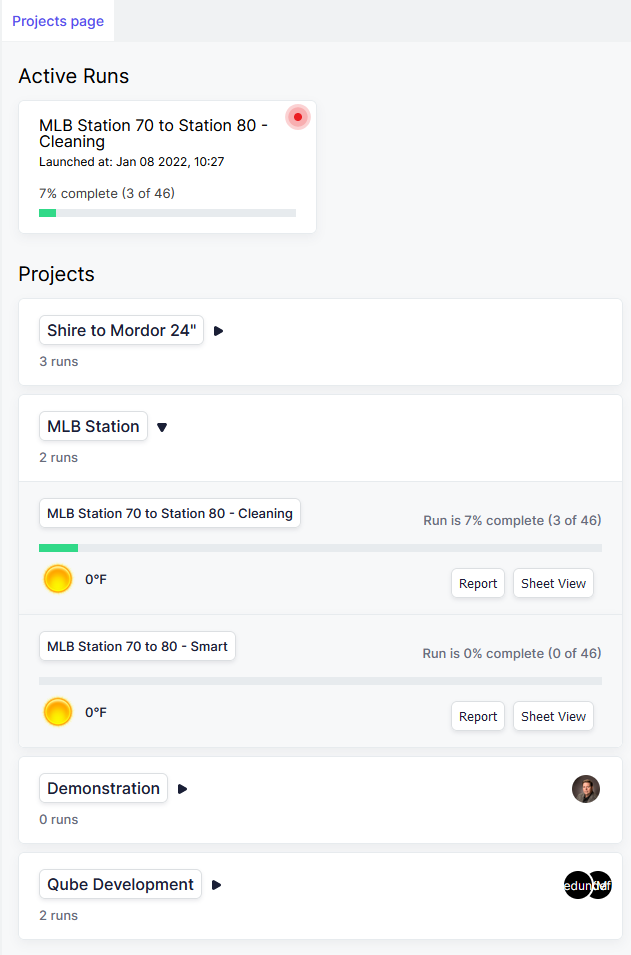
The Project List is the first view that you are presented with when you log in to GlobalTrack. The left side of the screen is a list of the Projects to which you have access.
At the top of the Project List are cards displaying all active runs that your permissions give you visibility to.
Below the Active Projects are any upcoming or completed runs that you have access to.
Clicking any of these cards will drill down into the Project and present you with a list of the Runs for that Project.
3.2. People List
The People List allows you to view and manage the users in the GlobalTrack system.
From the People List you can also send invitations to new stakeholders.
Todo
Enable People list so I can take fresh screenshots.
3.3. Map View
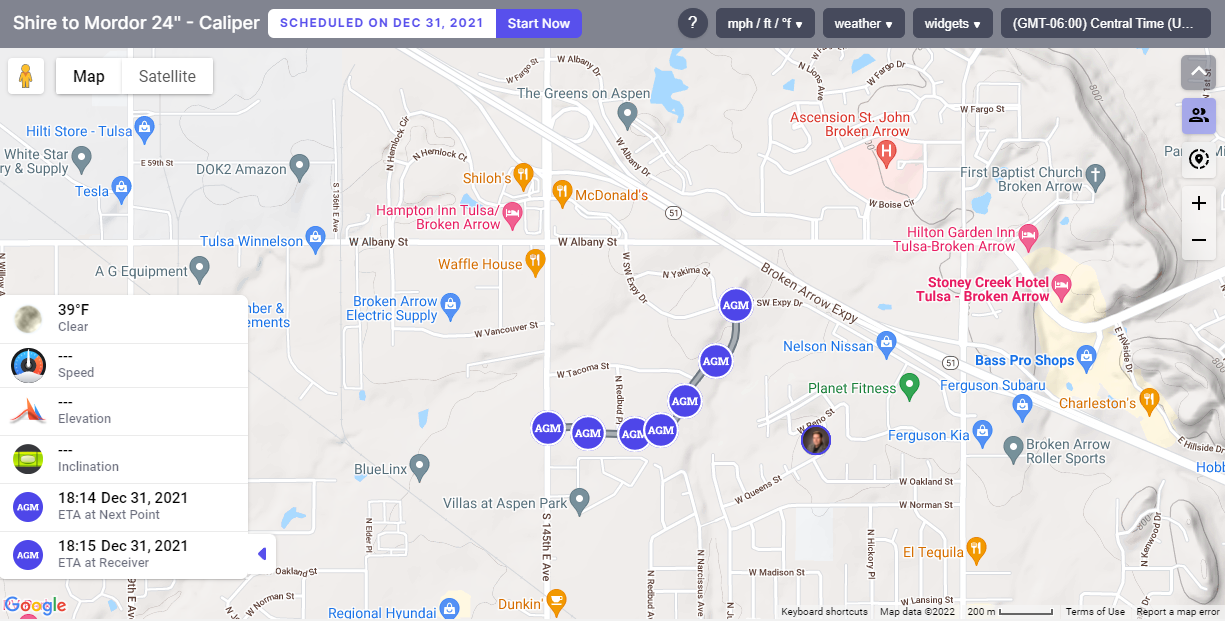
The Map View in GlobalTrack allows you to watch the progress of the pig simulation in real time. There are many tools and controls explained below that help to maximize this experience and make it more useful.
Tip
Use familiar Google Maps mouse techniques to pan and zoom the map!
3.3.1. On-Screen Widgets
3.4. Tool Ribbon
Across the top of the map is the Tool Ribbon. The Tool Ribbon contains information and a number of important tools.

3.4.1. Run Name
Leftmost in the Tool Ribbon is the name of the current Run. In this case Shire to Mordor 24” - Caliper.
3.4.2. Run Date
Next, is the scheduled date of the run. Clicking this date presents a dropdown dialog that allows you to schedule the launch date and time of the Run as well as the predicted or estimated launch speed.
3.4.4. Documentation Button
Clicking the small book-shaped Documentation button opens a new tab in your browser and presents you with the full documentation for GlobalTrack as well as a variety of other outside resources.
3.4.5. Help Button
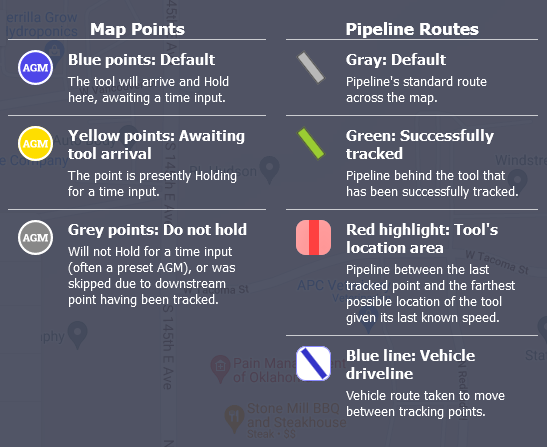
The next item along the Tool Ribbon is a ? button which provides a simple quick-reference to the icons and other features drawn on the map by GlobalTrack.
3.4.6. Units of Measure
3.4.7. Weather
3.4.8. Widget Settings
3.4.9. Time Zones
3.5. The Tracking Sheet
3.6. Trackpoint Icons
GlobalTrack defines Tracking Points as the points along the pipeline where a pig’s passage will be recorded. These points are often an AGM point, but they don’t have to be - any form of tracking device can be used to manually determine a pig’s passage and manually plug the time into GlobalTrack.
However, because AGM points are so often the type of point being tracked, they are used as the default icon for Tracking Points in GlobalTrack.
Important
The colors of the Tracking Points have very specific meanings which are described below.
3.6.1. Blue Icons
Blue is the default color for Tracking Point icons and indicates that the pig has not yet passed this location on the pipeline.
3.6.2. Yellow Icon
Blue icons turn yellow when the pig arrives at them. This indicates that, given the current estimated pig speed, the tool should have arrived at the location or is overdue. A blue icon turning yellow will Hold the pig’s progress down the pipeline in the simulation.
There are four conditions that allow the pig to proceed down the line when it arrives at a tracking point and that point turns yellow:
A tracking time input for this tracking point (manual or automated)
A tracking time input for any downstream tracking point (manual or automated). This effectively instructs GlobalTrack to ignore this point, at least for the time being.
A manual removal of the Hold flag (discussed below).
3.6.3. Grey Icons
Grey indicates that either no time entry is expected during the run for this point because its Hold flag was disabled (as for a preset AGM location), or that it was skipped because of a downstream tracking point time input.
Grey points can have times and dates added later with no negative consequence (for instance when preset AGMs are recovered from the field), but their color will remain grey indicating that the time was not gathered during the live run, but was instead entered later.
3.6.4. Changing the Trackpoing Icon
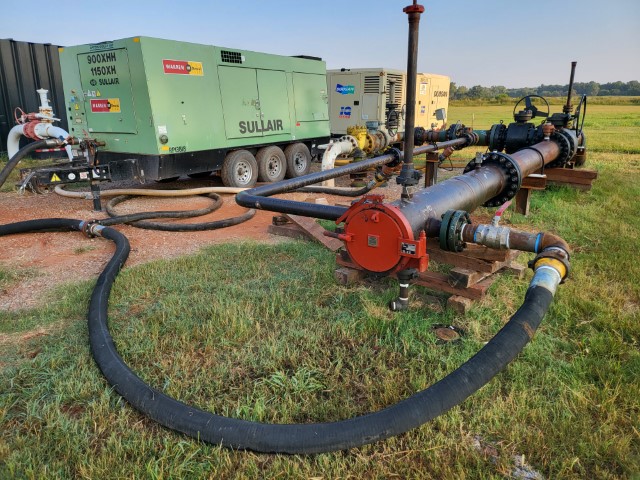
CDI GlobalTrack gives you the tools to create a pipeline route that looks like what you’re familiar with. This includes having the map reflect your pig launchers, receiver, valves, bends and more.
To change the map icons to your liking, click on the map icon you wish to change either in the tracking sheet or on the map. The sidebar will appear showing the details for that point. Click on the dropdown arrow next to the icon in the sidebard (see image).
This will present you with a dropdown list of icons to choose from. Select one and the icon on the tracking sheet and map will change. This selection is permanent until you change it again.
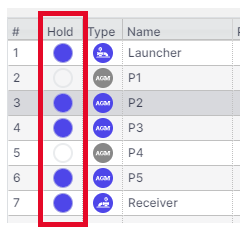
3.7. The Hold Flag
The Hold flag enables or disables GlobalTrack “holding” the pig’s simulated position at a tracking point when it arrives there.
Tip
If you’re initially confused by the Hold flag, don’t worry. Its purpose becomes clear with a little practice in a demo run.
3.7.1. Why is the Hold flag necessary?
The Hold flag is necessary to accommodate the variable and often unpredictable nature of pipeline pigging.
Imagine if you’re launching a pig train consisting of three tools and each of the tools are separated by 500 meters. Upon launching the first tool you start the GlobalTrack simulation and everything works well.
However, when flow is halted to allow the second pig to be inserted into the launcher, GlobalTrack doesn’t have any way to automatically know that flow has stopped. GlobalTrack will instead continue to flow the first pig down the line assuming that the launch speed is still valid. The longer it takes to load the second pig, the farther down the pipeline the simulated pig position would go and the more incorrect GlobalTrack’s simulation will become. This is a problem.
Instead, setting the Hold flag on the first tracking point in the line means that the simulation of the first pig will flow to that point and no farther until the actual tracking time of the first pig is entered. So regardless of how long it takes to load the second pig, the simulated pig location doesn’t pass the first tracking point.
There are a lot of valid reasons to turn the Hold flag off for a tracking point. Let’s look at a couple of examples:
Example 1: Preset AGMs
One of the most common reasons to disable the Hold flag on a point is that its going to be the location of a preset AGM. Since passage time inputs from those remote presets can’t be gathered during the run, removing Hold allows the simulation to smoothly flow past those point on the pipeline.
Example 2: Deliberately Skipping Points
Another reason to disable the Hold flag is that you have a run which was built for a smart tool with many tracking points, but now you want to run a simple cleaning run without tracking as many points. Perhaps you’re only going to track at valve sites. In this case you could disable the Hold flag for all of the tracking points that aren’t valve sites.
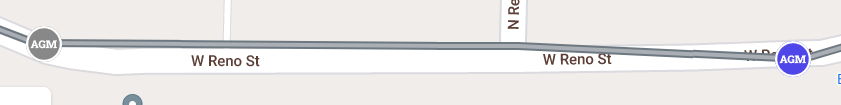
Here’s an example of what it looks like when a tool arrives at a location that is set to Hold and wait for a time input.
The tool arrives at the AGM location and the AGM marker turns yellow to indicate that a time input is being awaited, either from a manual or automatic input. The AGM location turns from the neutral Blue color to the “Awaiting Time” color of yellow.
3.8. Pipeline Route
The pipeline route is shown on the map and is one of the major features of GlobalTrack. The pipeline route can be displayed in several colors, each of which have specific meaning during a run.
GREY PIPELINE
This is the default color of the pipeline prior to a pig’s passage.
RED HIGHLIGHTED PIPELINE
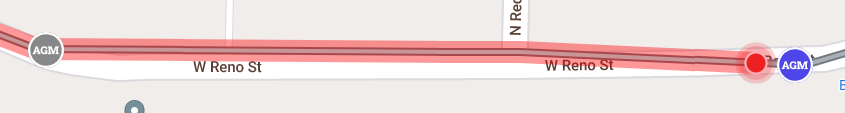
These colors (red pipeline with surrounding red highlight) indicate that the tool is downstream from this point, but that it has not yet been confirmed by a downstream time entry.
This is, in effect, a margin of error. The simulation knows that the pig is downstream from the last green Tracking Point marker but it cannot know precisely where since it’s possible that the pig’s speed has increased or decreased, or that the pig has become stuck.
3.8.1. Green Pipeline
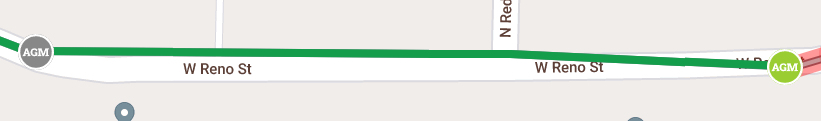
A green pipeline route indicates that the pig is known to be passed the segment of pipeline. GlobalTrack knows this because a time entry has been made for one or more downstream points.
3.8.2. Blue Driveline

The blue line that normally criss-crosses the pipeline is the Driveline. The Driveline is the path recorded by field personnel and uploaded along with, or in addition to the pipeline route’s KML or Shapefile.
When GPS location is turned on for the stakeholders on the pipeline, their location icons often show up moving along the Driveline.
3.8.3. Pig Location Marker
The position of the tool being tracked is represented by a pulsing red icon. It will always be located along the grey pipeline route.